|
Weather links: Sail: Surf: Stormwatch: Ocean: Profiles: Sky: Polar: Climate: Weatherfacts: Books: Products: |
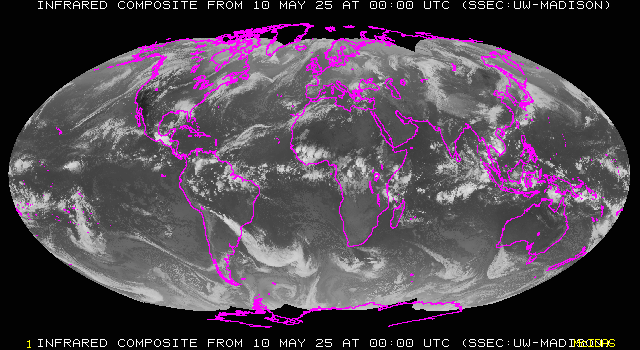
Volvo Ocean Race Weather links for the South Pacific and South Atlantic Routing notes for Leg Five: Rio to Miami Volvo Ocean Race contents page March 9: Gentle gradient winds provide coastal challenge for start of leg 5. Classic start from Rio March 9, 2002 There are some classic synoptic patterns emerging at the start of Leg 5 from Rio de Janeiro. With the South Atlantic High located 1200 miles to the south-east, a broad band of wind is rotating anti-clockwise around the centre of this high to flow from the north-east off Cabo Frio. But the breeze along that high country coastline between Rio and Cabo Frio, 60 miles east, will be prone to local influence - wind eddies underneath large headlands, locally accelerated gusts offshore of the same and, always, the threat of hot rising air inland distorting that gentle gradient flow. Sound complicated? It is, and that is what makes this start from Brazil's most famous carnival city so classic. Winds 24 hours before the start were badly affected by a localised trough, with very light and variable conditions, but this trough has evaporated leaving relatively clean gradient wind from the north-east - averaging 10-15 knots with stronger gusts. With a midday start, we can expect the fleet to hug the coast, not so close that they are blanketed by high headlands and not so far offshore to lose a seabreeze that will undoubtedly build during the afternoon. We can expect the fleet to approach the high headland of Cabo Frio before that seabreeze fades sometime in the late evening. And according to Volvo Ocean Race's Mike Broughton, this headland has plenty of tricks in store - from wind shadows to acceleration zones. Those familiar with this landmark will benefit, no doubt. The first jaunt to Cabo Frio is only 60 miles, but that cape marks a literal turning point for the fleet on their way north. Once around the high headland, we can expect the fleet to sail offshore into more consistent airflow and away from light and variable breeze close to the coast. Hot air rising inland creates notorious morning wind holes along this stretch of beach. The US Aviation model shows high pressure migrating slowly east, with winds veering to the east north of Vitoria (located about 20 degrees south) before veering further, to the south-east, as the fleet approaches Recife. There is nothing unusual in the forecast - this is typical autumn on Brazil's east coast. For that reason, the first boast around Cabo Frio may well hold her position until the doldrums. © Jamie Brown/weather-wise.com 2001 Surface pressure and winds With winds rotating counter-clockwise around high pressure in the South Atlantic, the Volvo fleet will encounter headwinds as they round Cabo Frio - due east of Rio - later tonight. But playing the local coastal conditions in those first 60 miles could be vital as high headlands and hot rising air inland could wreak havoc on this gentle gradient wind from the north. Note how the winds flowing around the zone of high pressure veers to the east then south east as you travel north. CONTENTS: Leg 5 updates Weather links for the South Atlantic and Caribbean Routing notes for Leg Five: Rio to Miami Volvo Ocean Race contents page Stay tuned here and at the official Volvo web site. Forecast Models: Build you own forecast chart using NOAA's AVN model. You stipulate latitude and longitude and what variables you want, i.e. barometric pressure at the surface or at 500mb, temperature at different levels, wind strength etc. Build you own forecast chart using NOAA's MRF model. You stipulate latitude and longitude and what variables you want, i.e. barometric pressure at the surface or at 500mb, temperature at different levels, wind strength etc. Forecast charts for the Southern Hemisphere using the European Medium Range Forecasting model. This link shows charts between three and six days in advance. 12 hour forecast of Surface pressure for the South Atlantic and Caribbean Sea compliments of Ocean Weather using the AVN model. Three to six day forecasts for the Atlantic courtesy of the European Centre for Medium Range Weather Forecasts Current surface pressure South-West Pacific Surface pressure forecasts up to 72 hours in advance using the US Aviation model, customised at the University of Wellington, NZ. Surface pressure for the South Atlantic and Caribbean Sea thanks to Ocean weather. Data includes contours of mean sea level pressure (in millibars) taken from the National Center of Environmental Prediction's Aviation Model. These maps are plotted every 3 hours, and are available approximately 1 hour after valid time. Surface pressure at present for South America, showing western Atlantic and eastern Pacific courtesy of IGES-COLA. Surface winds: Central North Atlantic surface winds (QuickScat). This image covers Panama to West Africa, north to 40 degrees and to five degrees south (about the latitude of Recife, Brazil. While lacking detail, and typically missing vast swathes of information, it does give you a quick overview of what's gong on coast to coast. It is particularly useful for monitoring activity along the Inter Tropical Convergence Zone, and finding the centre of North Atlantic high pressure. Quickscat satellite derived winds for the Southern Ocean: Waters south of Rio: Ascending and descending. Waters north of Rio: Ascending and descending. Recife to Guyana: Ascending and descending Caribbean Sea: Ascending and descending Bahamas and Miami: Ascending and descending 24 hour forecast for Wind and direction in both the north and south Atlantic, thanks to the ocean modelling branch of NOAA. (forecasts use the AVN model). Also: 48 hour forecast, 72 hour forecast, 96 hour forecast. Upper level wind charts The Aviation Weather Centre offers these terrific flight level charts SIGWX) which show the position of jet streams over much of the globe (mostly Northern Hemisphere). Because upper level winds, like the jet stream, steer our weather systems, knowing where these winds are and how they are behaving helps us to understand whether systems are moving east to west quickly or whether they will stalling because of a kink in the pipe-line. Forecasts up to 18 hours in advance. Infra red imagery Infra red satellite picture of South America (focus on the land mass, rather than the South Atlantic, unfortunately). Intellicast offers this colourful composite image showing the temperature of cloud tops - red, and especially purple, being the coldest; grey the warmest. This global composite is useful for viewing all of the South Pacific because images rarely cover the entire ocean from west to east. View animated weather systems in the central western Atlantic in stunning colour thanks to Intellicast. Black and white global composite image showing infra-red pictures of clouds. Detail is lacking and this one is not as easy to understand as Intellicast's coloured version above. However, this image, processed by the Space Science Engineering Center, University of Wisconsin-Madison , is also available as a four day animated movie and this is where this tool really begins to shine! More great reading: Get the good oil at the official Volvo web site. Read all about the Jacques Vabre trans-Atlantic race . Playstation smashes the trans-Atlantic record by 44 hours by surfing the perfect front! Battle of the Open 60s in the EDS Atlantic Challenge: Which route works best We analyse the Los Angles to Honolulu Transpac, 2001 Follow the Challenge Mondial Assistance through the official web site and get a preview of weather conditions on the route. Catch up on all the past action of the recent Vendee Globe in our race archive. Re-live the action between the world's fastest multihulls in The Race Re-live the 2000 Sydney to Hobart yacht race! Break ice in the Ross Sea! Re-live the solo trans-Atlantic race of June 2000 and the Quebec to St Malo of last August. |