|
Atlantic weather
links:
Get a grip on current conditions
Stormwatch:
Typhoons to tornadoes, we learn from
the event
La
Nina:
What is going on with our planet's weather?
Profiles:
Legends in meteorology
Antarctica:
Ross Ice Shelf loses some weight
Sailing:
Analysis of global racing
Southern Ocean:
There is no other animal like this one.
Ballooning:
Tasman crossing
Books:
Great reviews
Products:
Learn to think weather better
| |
Global coverage
From composite infra-red satellite images to
aviation charts, these links help to give you an overall picture of weather
around the world
Global:
- Intellicast offers this colourful
composite image showing the temperature of cloud tops - red, and
especially purple, being the coldest; grey the warmest. This global
composite is useful for viewing the whole Atlantic, because images rarely
cover the entire ocean from west to east.
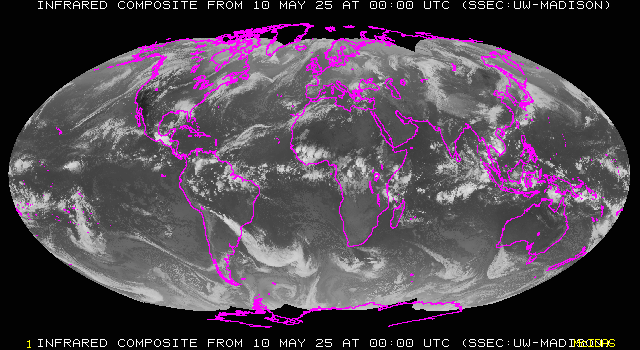
- Black
and white global composite image showing infra-red pictures of clouds.
Detail is lacking and this one is not as easy to understand as Intellicast's
coloured version above.
However, this image, processed by the Space Science
Engineering Center, University of Wisconsin-Madison
, is also available as a four
day animated movie and this is where this tool really begins to shine!
- The Aviation
Weather Centre offers these terrific flight level charts SIGWX) which
show the position of jet streams over much of the globe (mostly Northern
Hemisphere). Because upper level winds, like the jet stream, steer our
weather systems, knowing where these winds are and how they are behaving
helps us to understand whether systems are moving east to west quickly or
whether they will stalling because of a kink in the pipe-line.
- For information on
tropical storms world-wide, check out the National Hurricane Center's
homepage.
- Global
winds using 'quickSCAT' satellite technology. The results are sketchy,
but give an overall impression of surface winds and strengths. Very
colourful indeed! Courtesy of NOAA OPPT.
By the way, clouds wreak havoc with surface data, unfortunately,
and because you can't see the clouds in this image this image may, or may not be so helpful.
- Global
500 mb Height and Surface Pressure from the AVN Model courtesy
of SOEST-University of
Hawaii.
©
weather-wise.com 2000
|